Simplifying the learning process through Visual Design
When you think of an elephant what to you see? Do you see the word “elephant” or do you see large floppy ears, a wagging tail, and tusks on a 4 ton grey mass? Most people will think of the actual animal and visualize this image in their brains rather than the actual word “e-l-e-p-h-a-n-t.” We retain visual information quicker, and for a much longer time, than we remember the written word. So when it comes to explaining complex systems, an info graphic is the best approach.
Our minds can absorb facts and figures presented in an infographic three times faster than just reading plain text. Experiencing a concept visually with an image or a drawing is much more effective than reading an article or paragraph about a particular idea, product, or complex system without any visual representation.
Another great thought to consider is that visitors to a website are much more likely to click on a link if it contains an infographic, and the majority of people who view an infographic will share the graphic or diagram with their friends, family, or coworkers.
If you think about it we have all been using and viewing info graphics since we were born. When my kids were infants I was showing them plenty of info graphics, whether it was drawings of animals graphically organized on the thick cardboard pages of children books, or the tree painting I created in the bedroom of my daughter, properly labeled “tree”. Now that she is in kindergarten I can see that most of her worksheets are actually forms of infographics with all the pictures paired with numbers, words, arrows, etc.
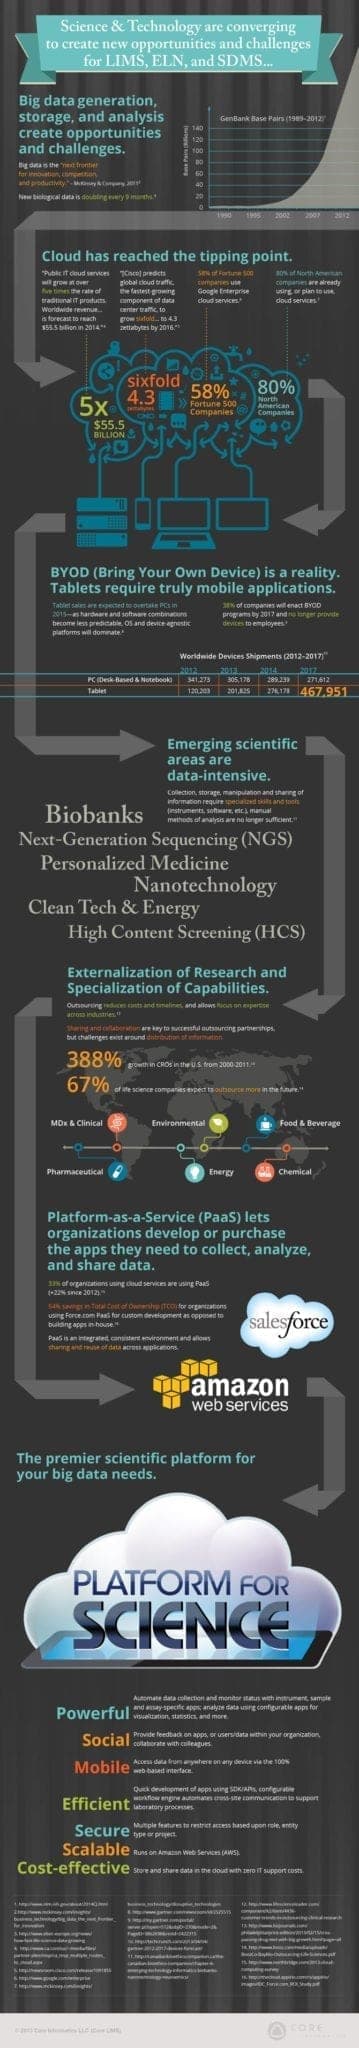
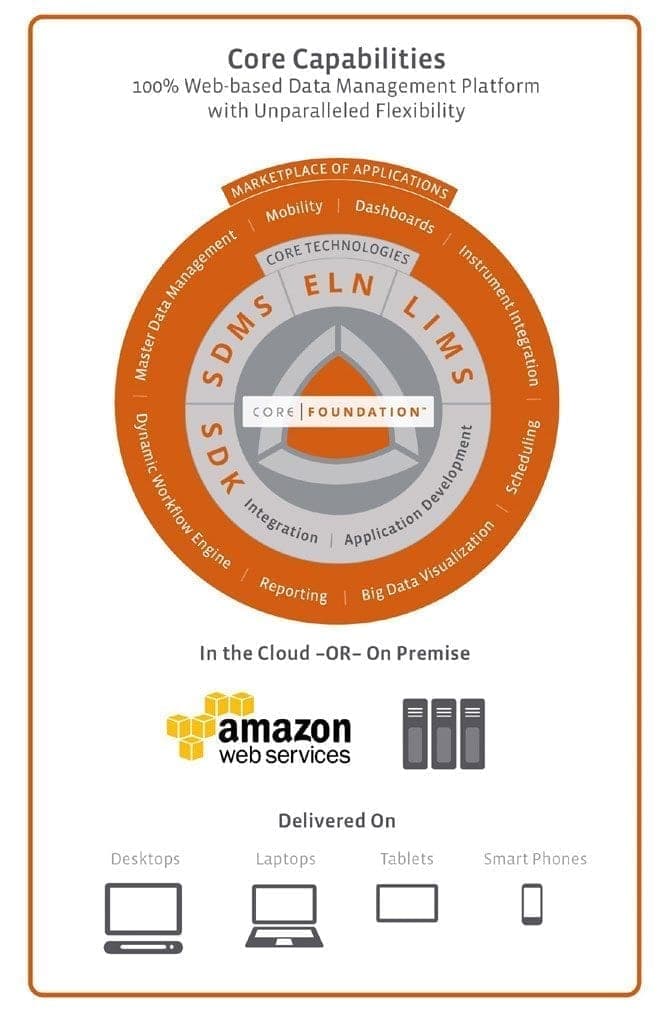
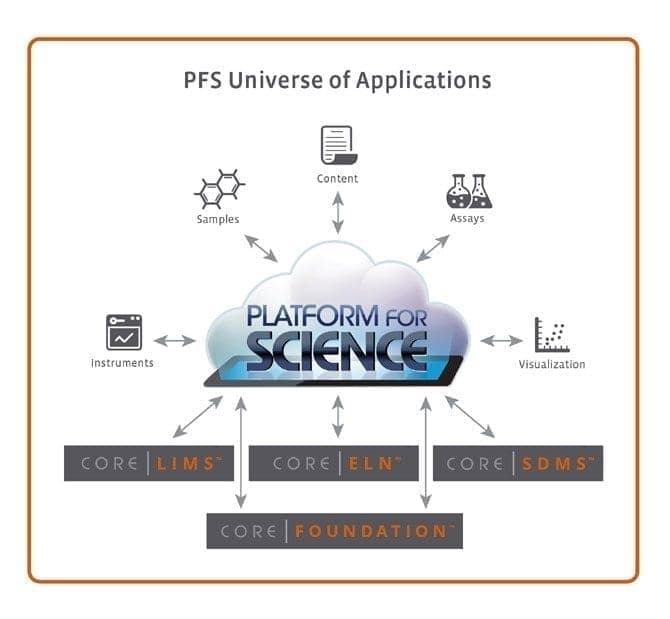
The more I think about it the foundation of all of our education and daily life is focused around infographics in the form of educational diagrams, eye-wash station graphics in chemistry class, choking posters in restaurants, they have always been there and they always will be. Whether it’s an infographic on how to add or subtract, or complex systems like the Core Informatics infographics seen below, it’s visual media explaining a particular concept that our minds will successfully absorb much quicker than the written word.
Contact Zero Gravity Marketing today and let’s discuss how an infographic will help your business explain and illustrate the flow of information you are trying to convey and ultimately increase visits and conversions on your website.
Example Infographics: