Daily social media use is more common than ever before. As a business, it is important to go beyond just creating a few posts a week per channel and waiting to see what happens organically. In fact, the only way to really achieve traction is by utilizing a strong paid advertising strategy with a particular target audience in mind.
This is where our team of experts at Zero Gravity Marketing (ZGM) can help. We’re absolute fanatics about all things digital marketing and social media, which is exactly why we’ve compiled this report with information on what to expect when it comes to running ads on platforms like Facebook and Instagram.
In addition, we created this paid social benchmark guide to give you a solid idea of what our ZGM digital marketing clients have seen and why working with us is a great way to achieve similar results.
Average Paid Social CPM by Industry
How much are you paying for social media ads? Unlike Pay-Per-Click (PPC) advertising, paid social is based on cost per mille (CPM): The average cost for 1,000 impressions. This means that the rate is formulated by the number of people who view the ad, not the actual clicks the ad receives.
This is an important Facebook and Instagram ad benchmark as it relates more to the audience who sees the content and not just those that take action after viewing it. In addition, a high number of views can also equate to better brand recognition overall. CPM also affects the efficiency of campaigns, because higher CPMs indicate increased marketplace competition.
Q4 2021 The average CPM across all industries was $10.15, with the most expensive in the Travel industry at $29.31. The industry with the lowest CPM was the Apparel at $7.71
Q3 2021 The average CPM across all industries was $10.18, with the most expensive being in the Travel industry at $34.06. The industry with the lowest CPM was Technology at $2.64
Q2 2021 The average CPM across all industries was $9.64 with the most expensive being in the Construction industry at $14.35. The industry with the lowest CPM was the Auto & Real Estate at $5.95
Average Paid Social Engagement Rates by Industry
After views, the next important KPI to consider is engagement. What does this mean? When you make a paid social post, you want to pay attention to the number of comments, likes, clicks, and other interactions people make.
As a key component of Facebook and Instagram ad benchmarks, this gives you a clear indicator of the quality of the content you’re promoting. If a particular post has a higher than industry standard amount of engagement, then you’re probably on the right track.
It’s also important to remember that paid social benchmarks can really vary by industry. While some niches are a lot more interactive, there are still those that don’t seem to get a lot of audience engagement as a whole. It’s important to build an engaged audience both organically to build social proof for those who land on your profile, but it also allows your paid social team to build an efficient retargeting audience of those who have engaged with your content.
Q2 2021 The average Engagement Rate across all industries was 8.34% with the most engaged being the Construction industry at 14.24%. The industry with the lowest Engagement Rate was Technology at 1.13%
Average Paid Social CTR by Industry
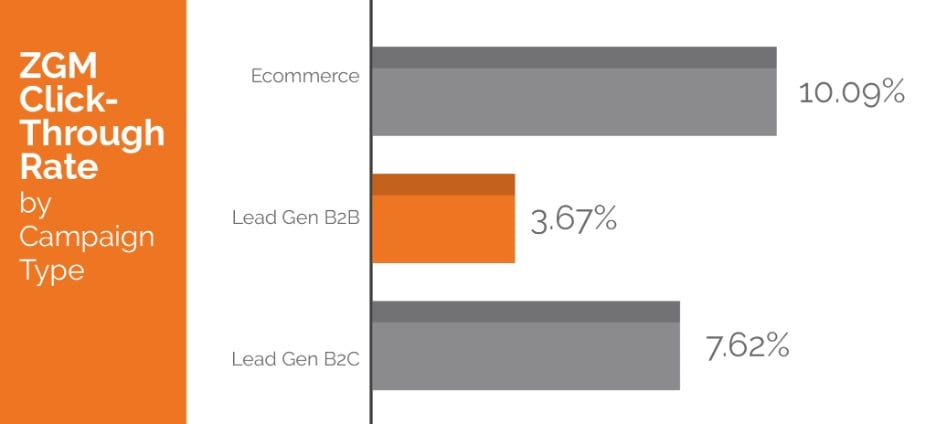
Finally, you’ll want to pay attention to the click-through rate (CTR) for your particular industry. This is where the actual number of clicks on your ad comes into your strategy. Remember, a click is when someone physically clicks on an ad and goes to your website.
Clicks are always a good metric to track because these are the members of your target market who are invested enough in what they saw on your ad to take immediate action. If your results for CTR are lower than your industry benchmark, it might signal a need for better ad copy or graphics. CTR also indicates the relevancy and success of a specific ad unit and can help inform the next phase of ad creative.
Q4 2021 The average Click Through Rate across all industries was 0.61%, with the most engaged in the Baby & Children's Products industry at 1.13%. The industry with the lowest Click Through Rate was Construction at 0.13%
Q3 2021 The average click-through rate across all industries was 0.94%, with the most engaged being the Baby & Children Products industry at 1.55%. The industry with the lowest click-through rate was Travel at 0.56%
Q2 2021 The average Click Through Rate across all industries was 1.30% with the most engaged being the Baby & Children Products industry at 2.08%. The industry with the lowest Click Through Rate was Technology at 0.79%
Why Should You Pay Attention to Social Media Advertising Benchmarks?
Tracking paid social media benchmarks for your particular niche or industry is important, as it gives you a solid way to compare your results to what others are seeing. The good news is that if you’re above these figures, then you’re doing better than the competition. If you’re below them? Well, then it might be a good idea to get in touch with our ZGM team.
Tracking this information tells you if what you’re spending on Instagram and Facebook feed ads is really worth the effort. It also gives you the ability to drill down and determine where there might be an issue with your current campaigns.
FAQ - Instagram and Facebook Ad Benchmarks by Industry
Do you still have questions about the information we’ve added to this report? That’s okay! Our ZGM team has added this short list of frequently asked questions to help you out.
It used to be simple to put a few social media posts up online and hope for the best. These days, there are only so many chances to catch the attention of your target audience, which means you need a way to get in front of them faster. By engaging in solid paid advertising campaigns, you can ensure your content is in front of the right people at the right time.
Our ZGM team has gathered the information in this benchmark guide from clients we are currently working with. The information is a combination of specific reporting tools that we use, plus information from the social media platforms themselves and Google Analytics.
The truth? It really depends on the industry you’re in and what you’re hoping to achieve. If simple brand recognition is your only goal, then it is probably okay to just be concerned with CPM and the number of views. If you’re looking to grow your audience, then interaction is key. And, finally, if you need sales or leads, you’ll want a high CTR.
Wrap Up: Digital Marketing Paid Social Benchmarks
While there are many excellent digital marketing methods to grow your business, paid social is one of the fastest and most useful options. By comparing your individual results with the industry benchmarks we’ve added in this report, you can easily see whether your current campaigns are working or if you need additional assistance from an experienced agency.
Ready to learn more about how ZGM can help you achieve better results from your paid social campaigns? Please contact us today to learn more.
