Driving traffic to your website or landing page is an important aspect of digital marketing. If you aren’t currently engaging in Pay-Per-Click (PPC) advertising, now is as good of a time as any to get started. However, where many companies fail when doing this on their own is by not knowing what a successful campaign looks like or even how to track if what they’re doing is working.
And that’s where we can help. Our knowledgeable and experienced team has put together this report detailing Google Ads industry benchmarks. It also includes business type benchmarks (eCommerce vs. B2C lead generation vs. B2B lead generation) to help you see where our clients in your industry are faring, and what results to expect should you take on a similar type of campaign. While these are just examples, it is designed to give you a good idea of how well paid marketing works for companies just like yours.
This digital marketing benchmark guide is meant to help you understand what our Zero Gravity Marketing (ZGM) clients are experiencing so you can envision your own level of success should you make the decision to work with us.
Average Cost Per Click in Paid Search
If you’re just starting out with paid advertising, cost per click (CPC) is one of the metrics that you’ll want to pay really close attention to in your campaigns. Why? CPC is how much it costs each time someone clicks on your Google Ad. You don’t want this number to get too high, as it can really have a negative effect on your overall marketing budget if you aren’t getting conversions.
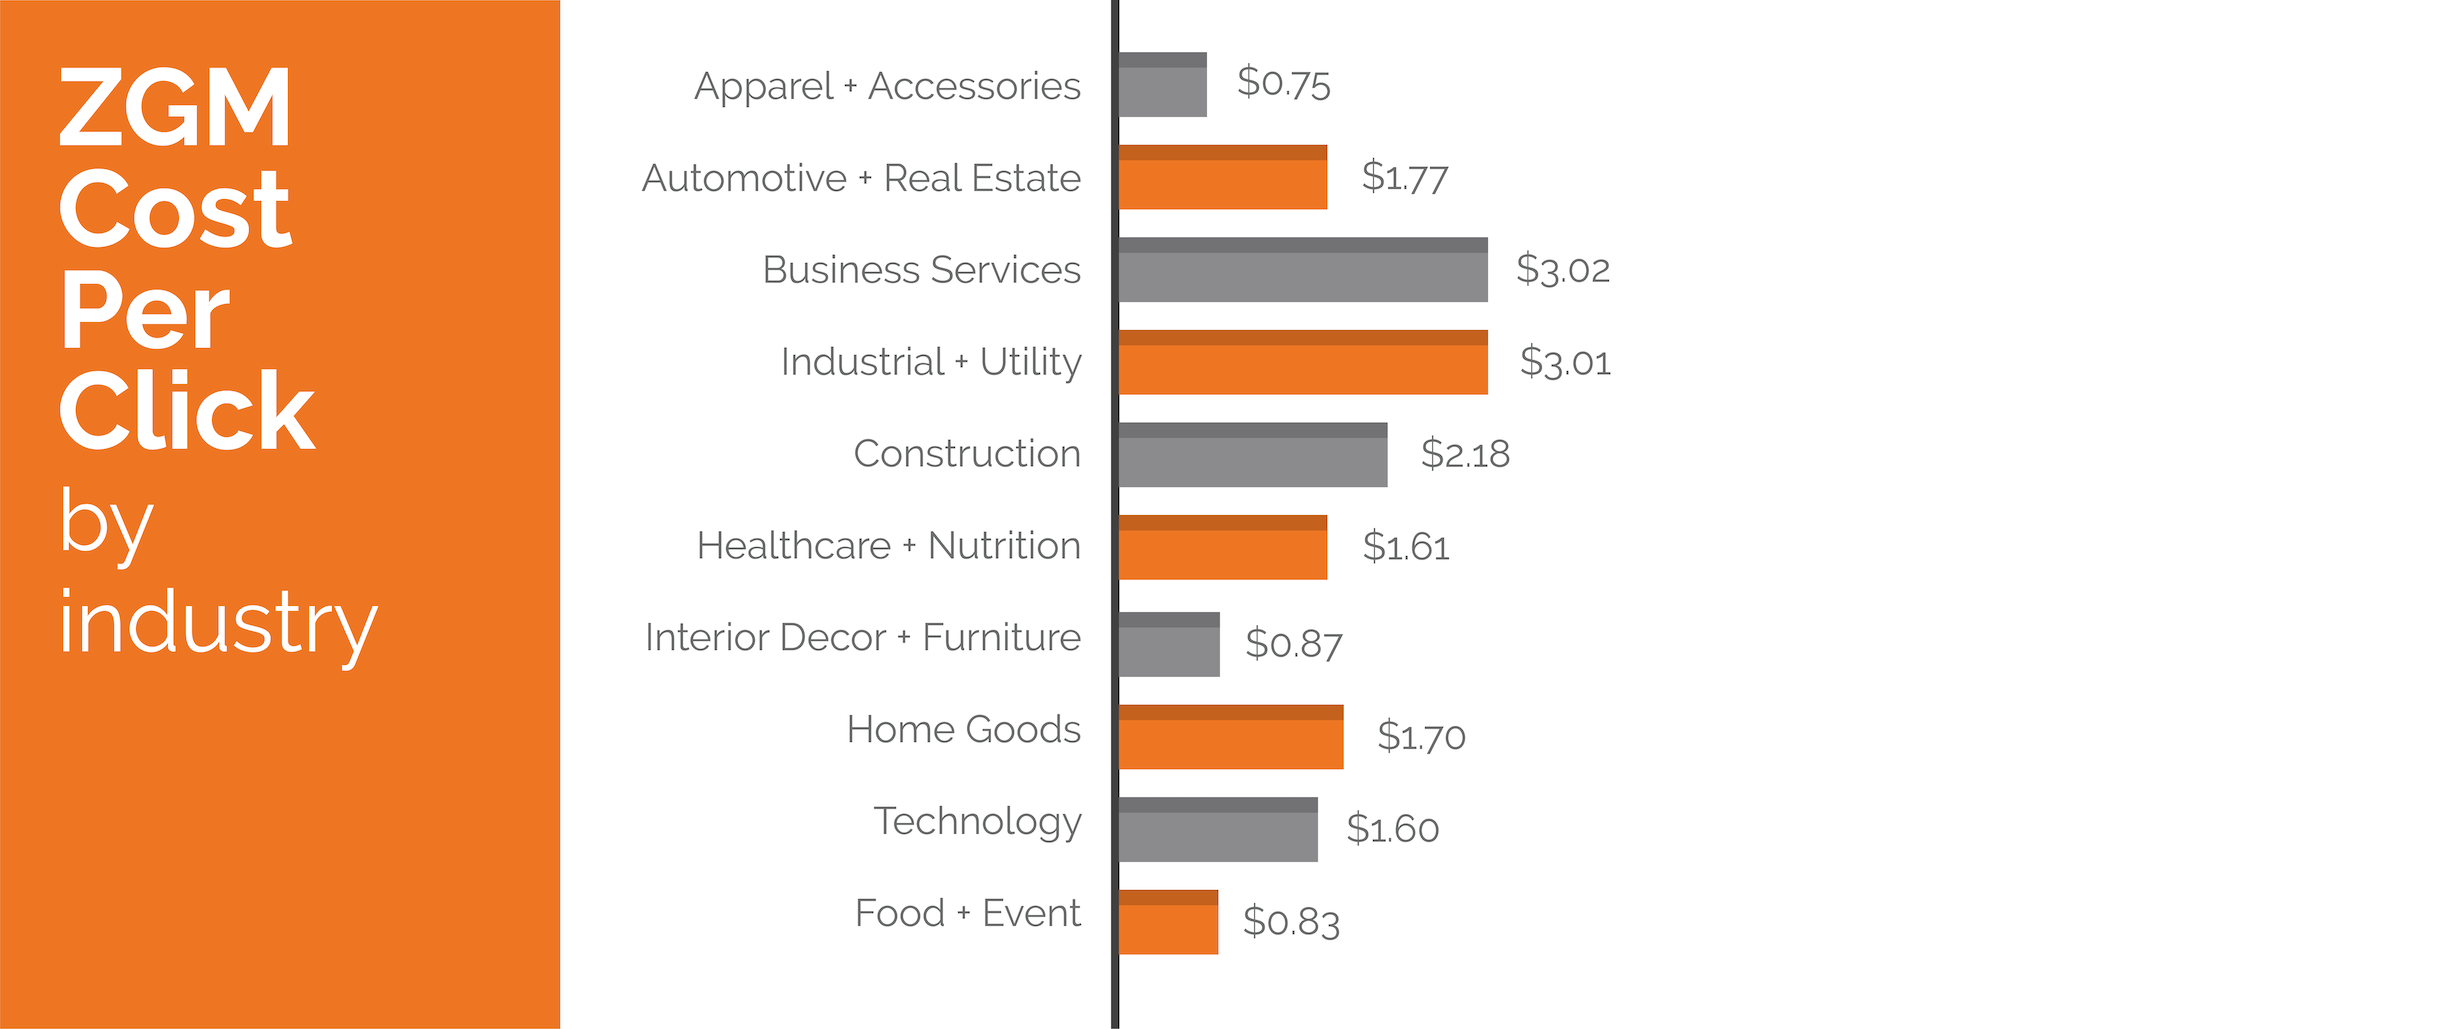
Cost Per Click By Industry
The average CPC across all industries was $1.99, with the highest CPC being in Business Service at $3.90 due to increased competition. This was because there was more demand for this industry during the start of the year.
The lowest CPC was the Apparel & Accessory industry with $0.62. Opposite to the Business Service industry, there was less demand for Apparel & Accessory in Q1 as many consumers got their fix during the holiday season in Q4.
2022 Q1
• The average CPC across all industries was $1.99, with the highest CPC being in Business Services at $3.90 due to high competition.
• The lowest CPC was both the Apparel/Accessories industries with $0.62
2021 Q4
• The average CPC across all industries was $2.00, with the highest CPC being in Construction at $4.61 due to high competition.
• The lowest CPC was the Baby & Children's Products industries with $1.07
2021 Q3
• The average CPC across all industries was $2.05, with the highest CPC being in Technology at $4.94 due to high competition.
• The lowest CPC was the Baby & Children's Products industries with $0.90.
2021 Q2
• The average CPC across all industries was $1.83, with the highest CPC being in Technology at $5.96 due to high competition.
• The lowest CPC was both the Apparel/Accessories industries with $0.70
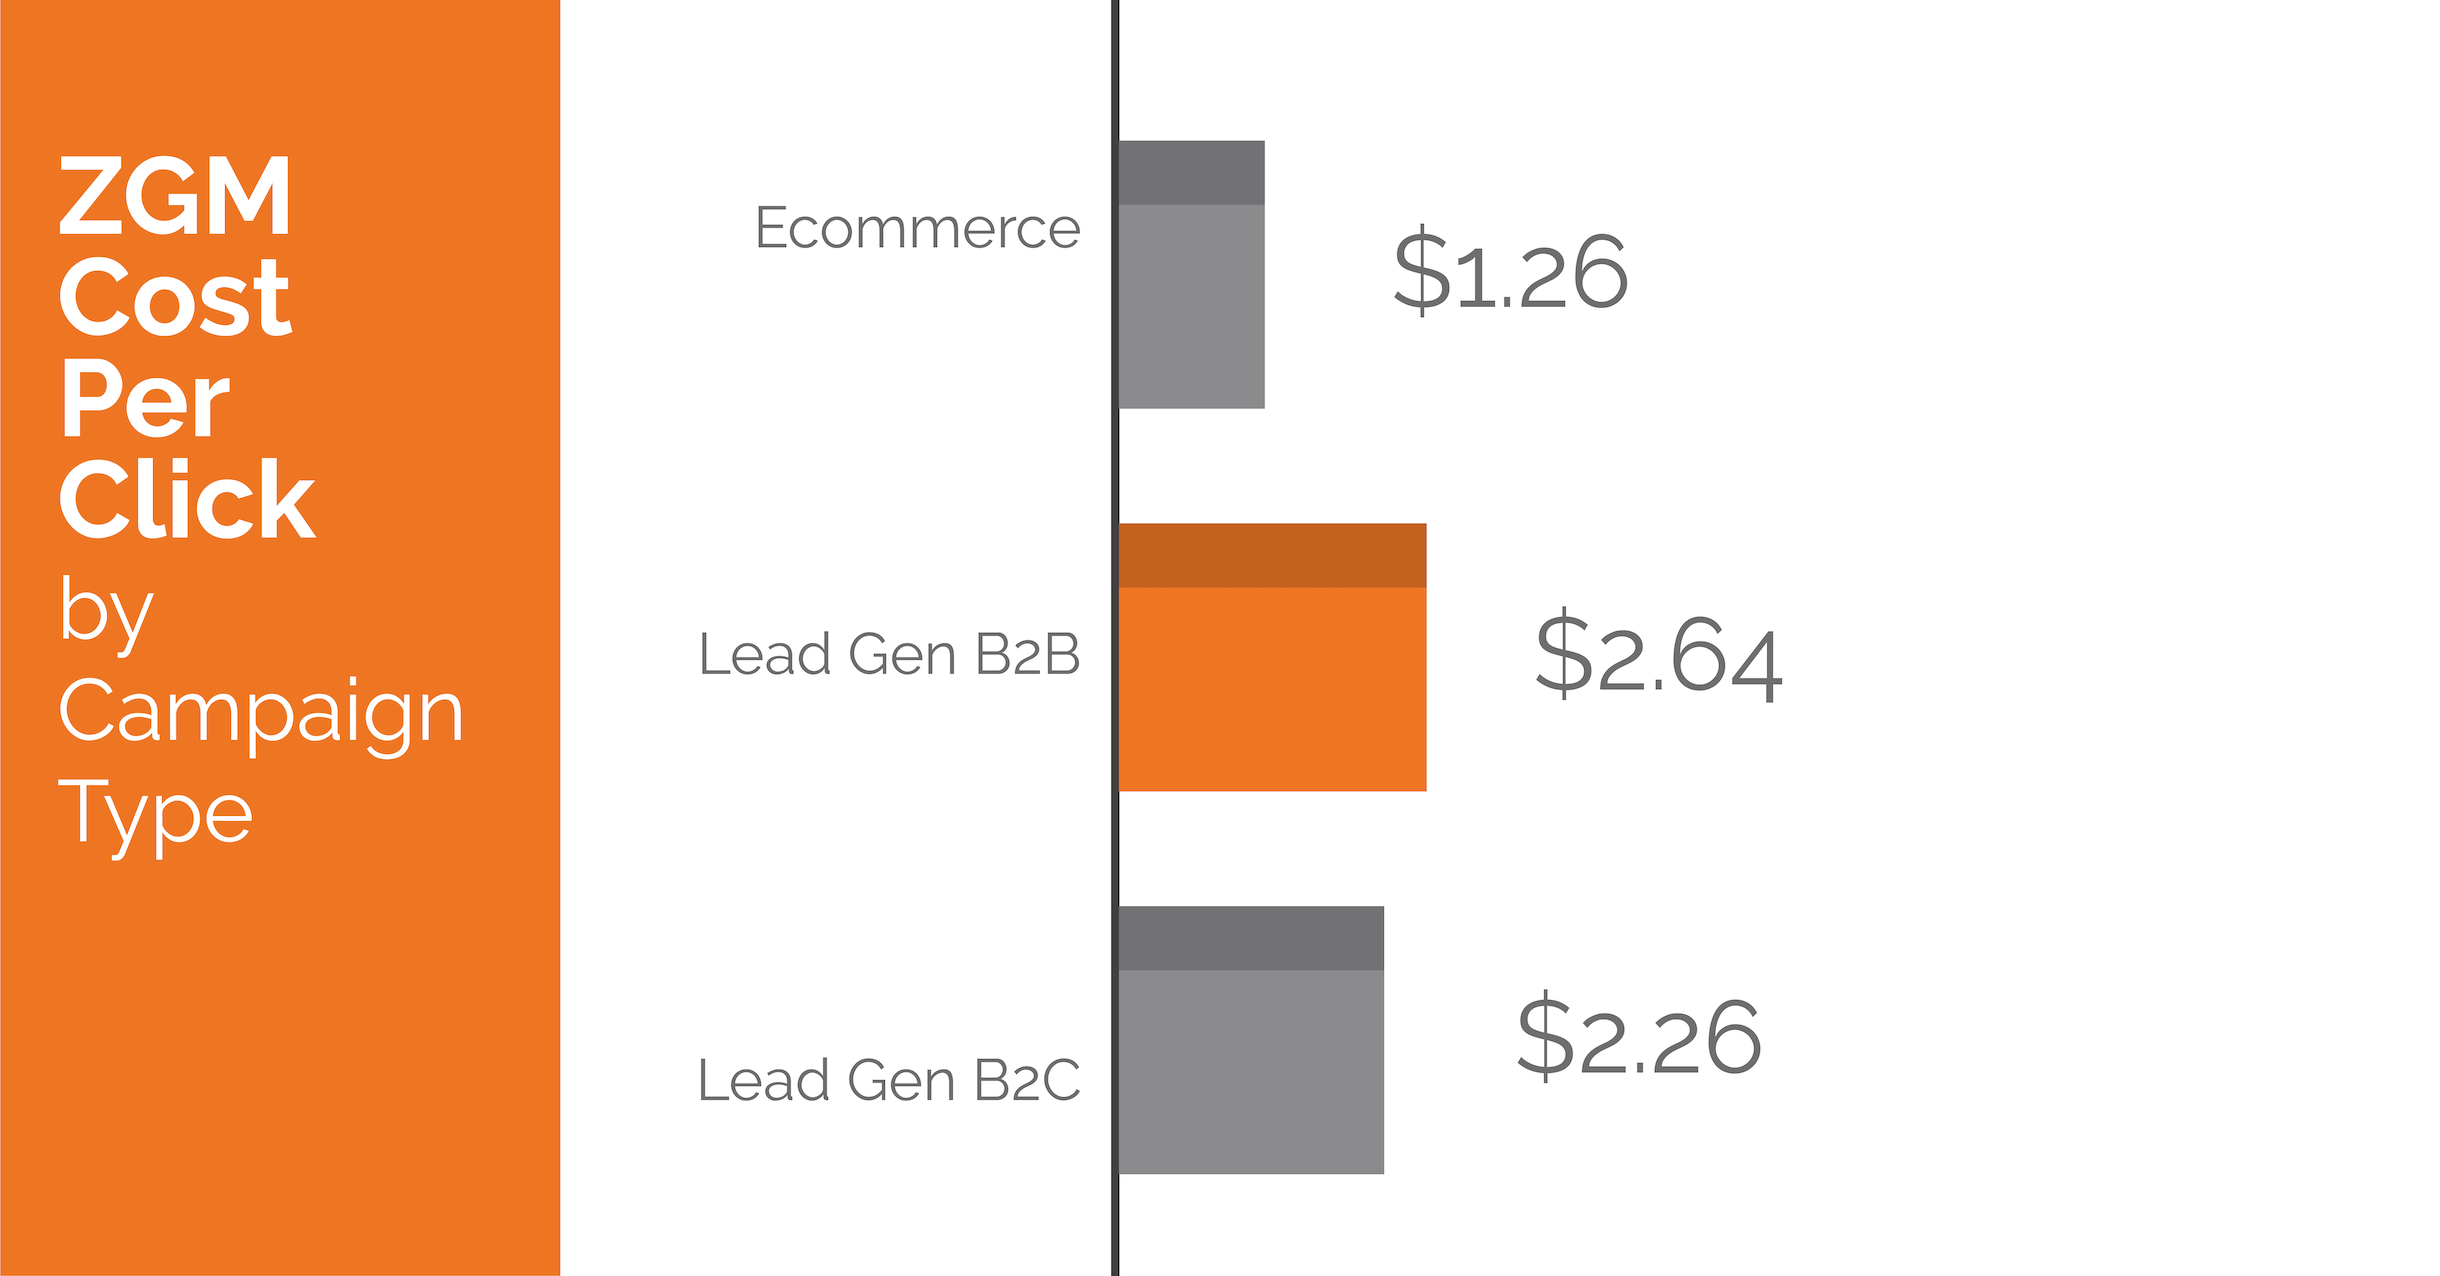
Cost Per Click By Business Type
Due to the high competition, the highest CPC across business types was Lead Gen B2B, with a $2.64 CPC.
However, eCommerce came in with the lowest CPC at $1.26. Similar to the above, because of the wide variety and different types of products that can be purchased within the industry, there is less competition when businesses start targeting niche keywords.
2022 Q1
• eCommerce - $1.01
• Lead Gen B2B - $4.51
• Lead Gen B2C - $2.39
2021 Q4
• eCommerce - $1.24
• Lead Gen B2B - $5.49
• Lead Gen B2C - $2.32
2021 Q3
• eCommerce - $1.14
• Lead Gen B2B - $5.38
• Lead Gen B2C - $2.24
2021 Q2
• eCommerce - $1.14
• Lead Gen B2B - $5.38
• Lead Gen B2C - $2.24
2021 Q1
• eCommerce - $1.57
• Lead Gen B2B - $3.87
• Lead Gen B2C - $2.27
2020 Q4
• eCommerce - $1.57
• Lead Gen B2B - $3.87
• Lead Gen B2C - $2.27
Average Click-Through Rate in Paid Search
When tracking the effectiveness of Google Ad campaigns, average click-through rate (CTR) is another metric that’s good to keep tabs on. This figure is essentially the number of people taking action and actually clicking on your ad, versus those who just see it and take no action. For some B2B industries, this might be lower but still signal success.
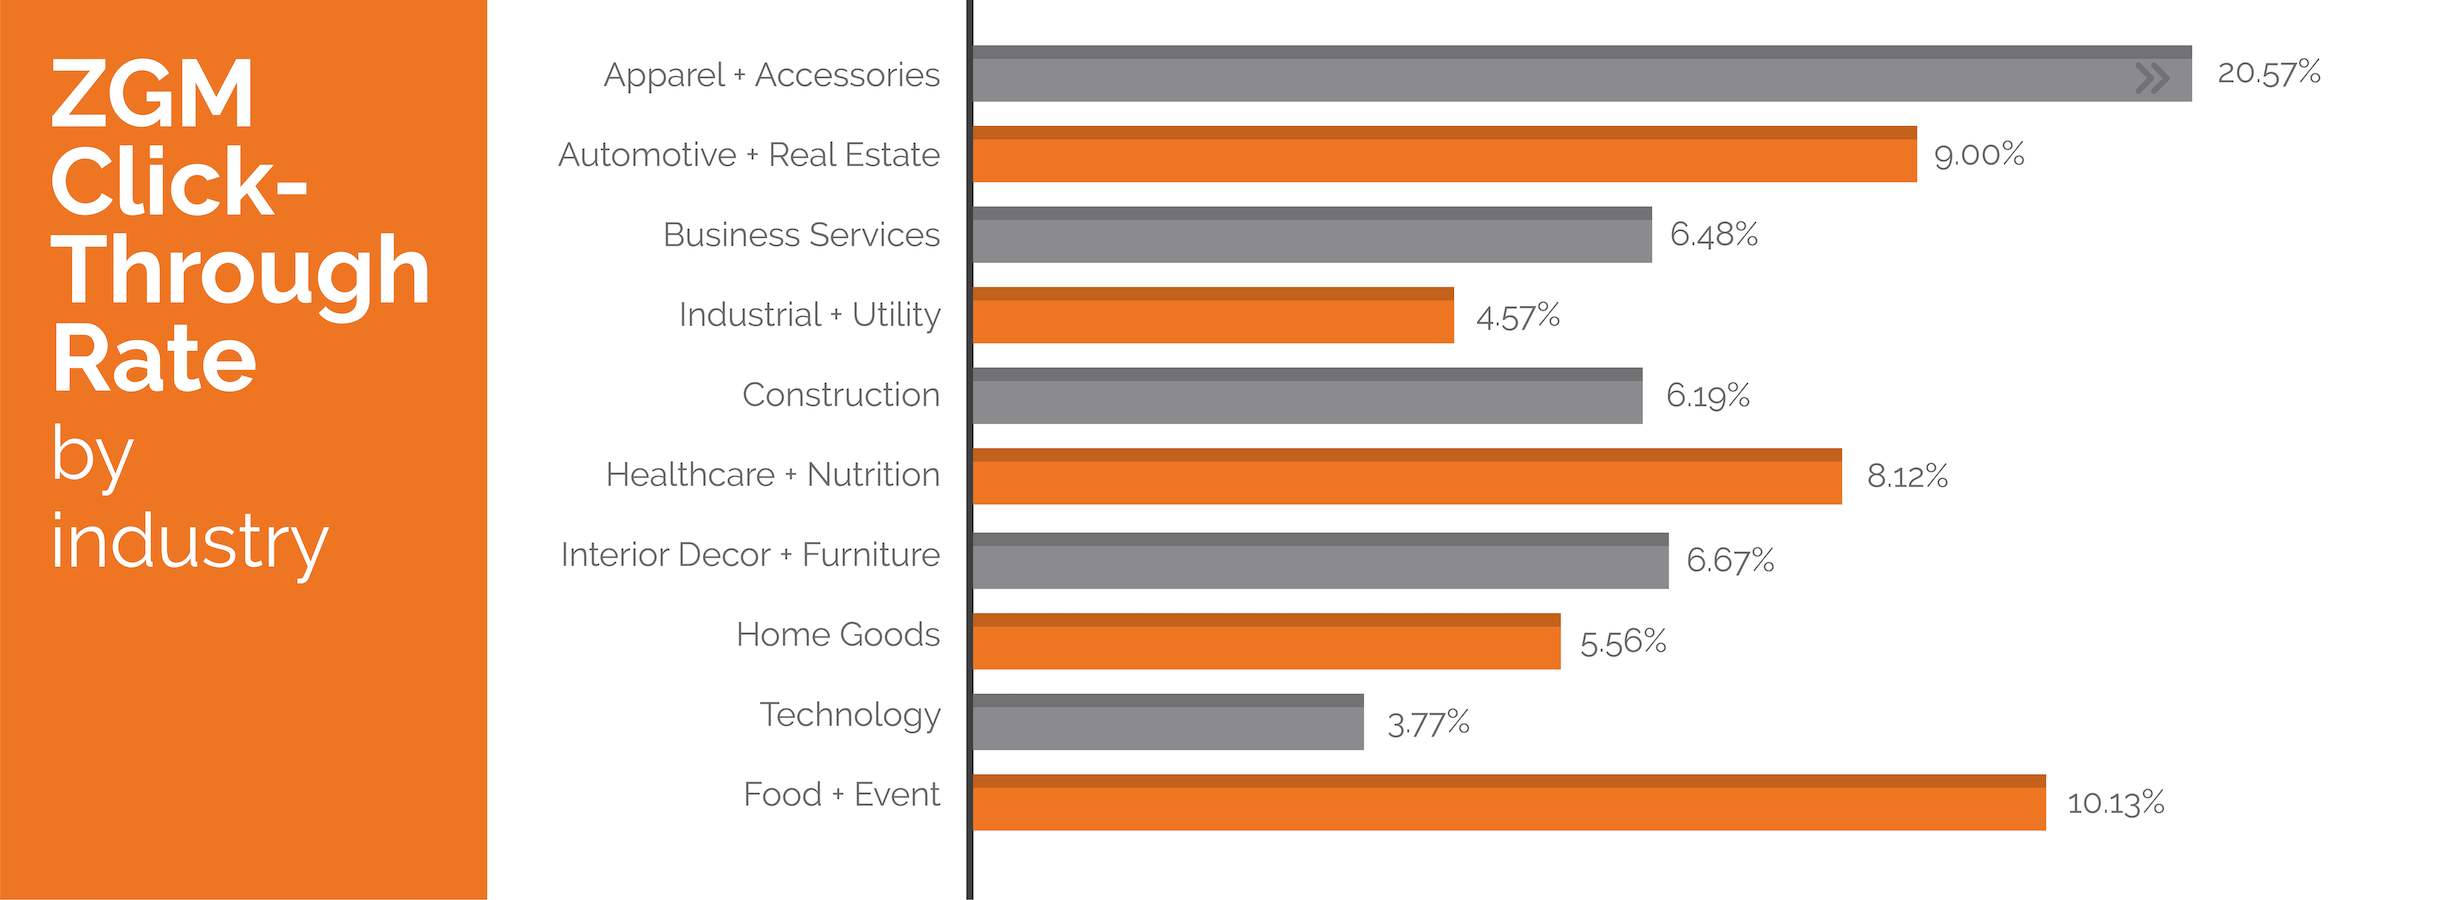
Average Click-Through Rate By Industry
The average CTR across all industries is 7.20%.
The Apparel & Accessories industry had the highest CTR at 20.57%. With such low CPCs during Q1, it is unsurprising that this industry could create high engagements as the budgets could go farther than in prior quarters.
The industry with the lowest CTR was Technology, with 3.77%. With the focus of most Q1 digital activity around upgrading business services or new years resolution related queries, it's no surprise to see this industry fall flat during Q2.
2022 Q1
• The average CTR across all industries is 7.42%.
• The Apparel + Accessories industry came in with the highest CTR at 15.13%.
• The industry with the lowest CTR was the Industrial + Utility industry with 3.88%.
2021 Q4
• The average CTR across all industries is 7.31%.
• The Accessories industry came in with the highest CTR at 9.79%.
• The industry with the lowest CTR was the Healthcare + Nutrition industry with 1.55%.
2021 Q3
• The average CTR across all industries is 6.22%.
• The Baby & Children's Products industry came in with the highest CTR at 11.05%.
• The industry with the lowest CTR was the Technology industry with 3.45%.
2021 Q2
• The average CTR across all industries is 5.54%.
• The Home Goods industry came in with the highest CTR at 8.41%.
• The industry with the lowest CTR was the Technology industry with 2.16%.
Average Click-Through Rate By Business Type
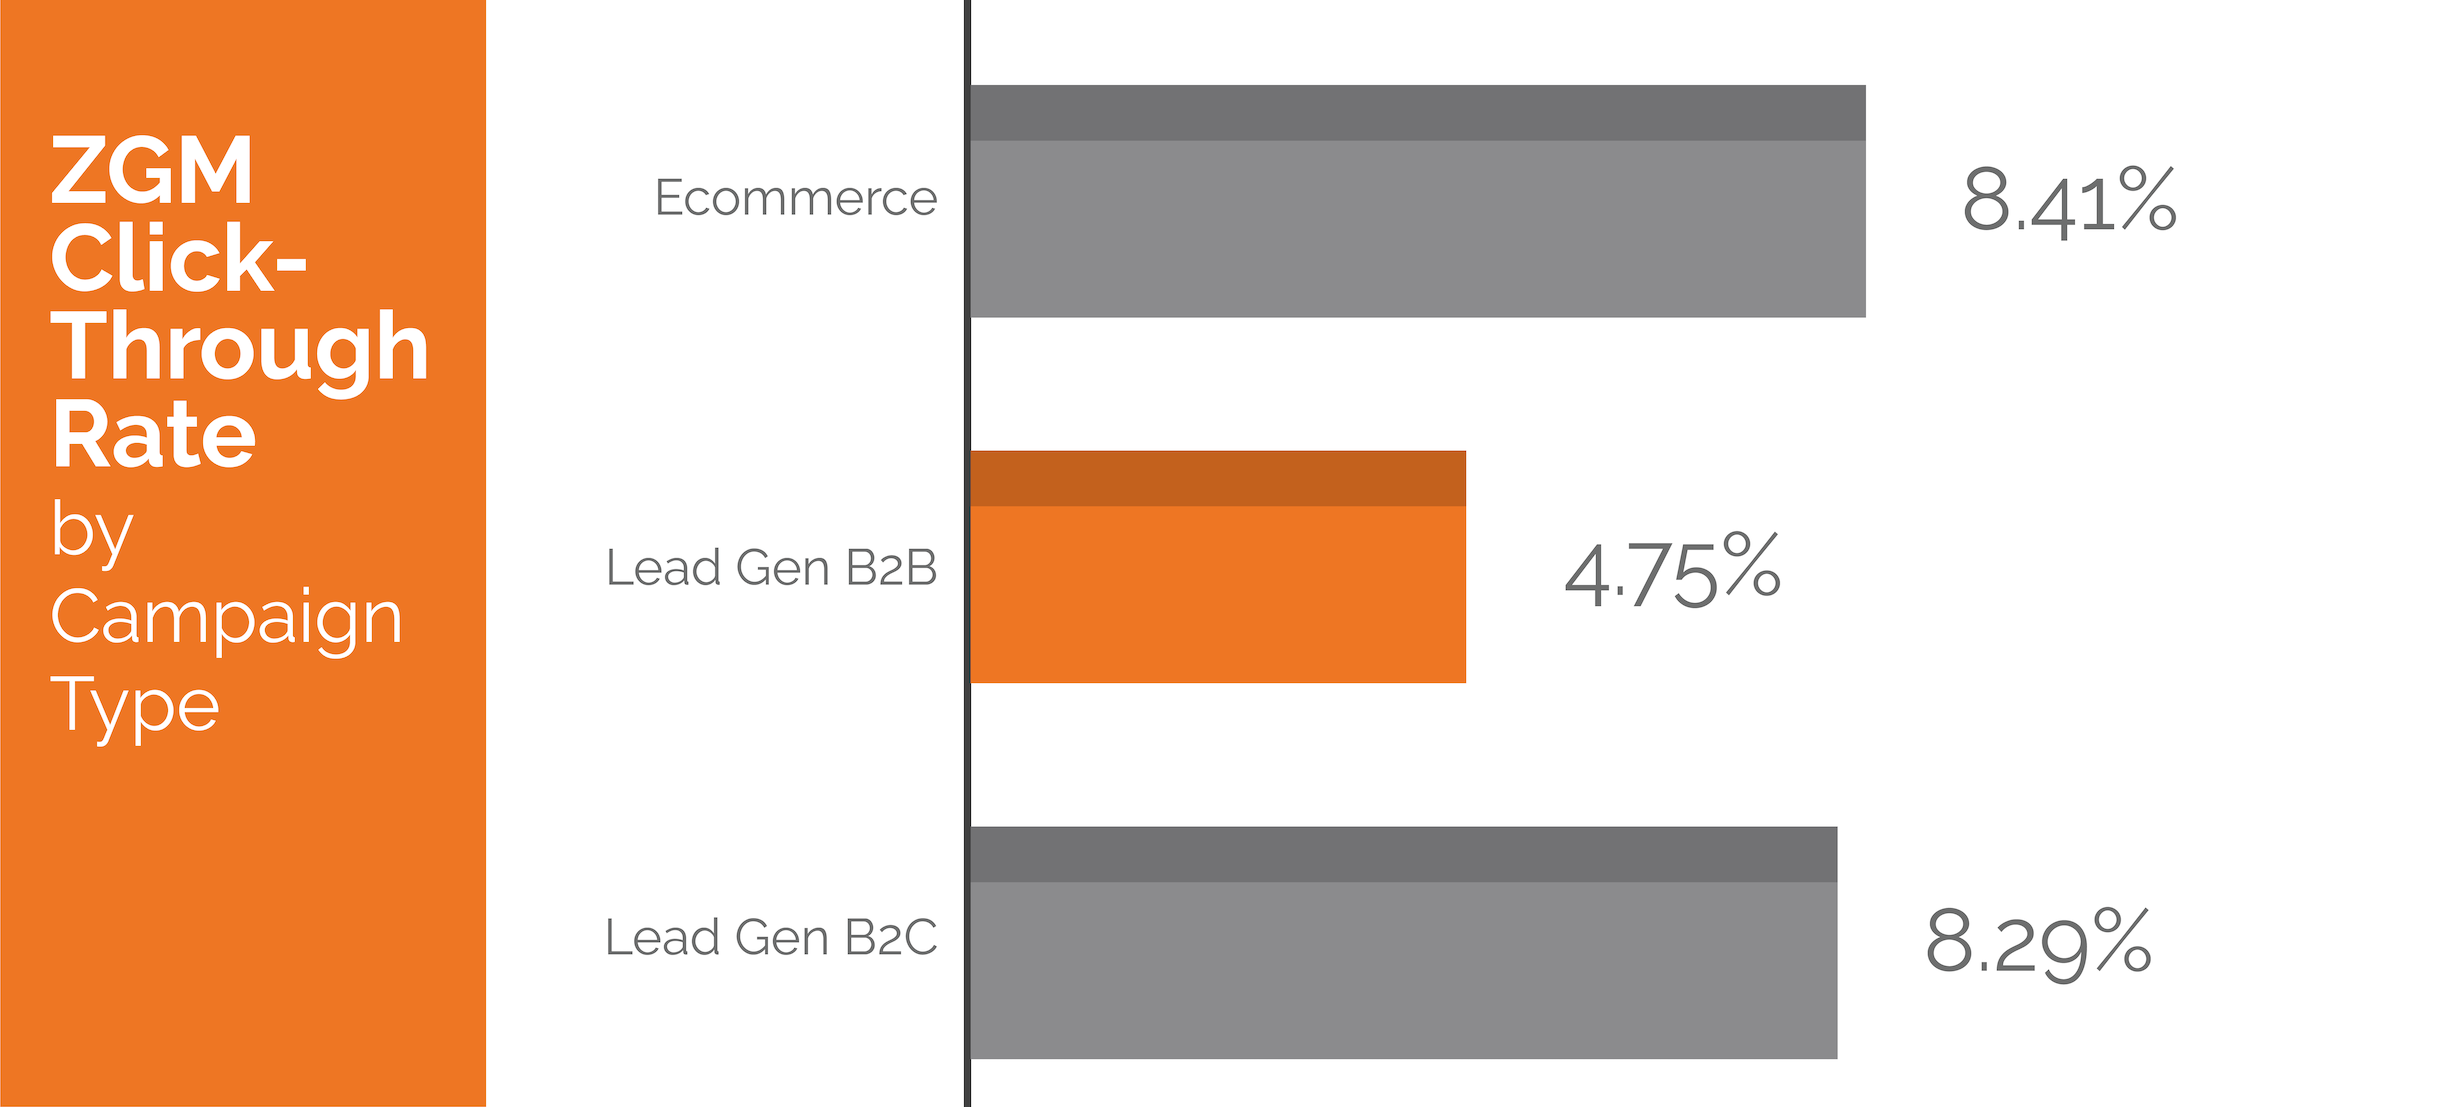
eCommerce was the business type with the highest CTR at 8.41%.
Lead Gen B2B had the lowest CTR at 4.75%. Unsurprisingly, this makes sense because this business type does a ton of research before committing to a company or service. Since the consumer is another business, they also may have a better understanding of the advertising methods or be “in” on them, so they’re purposely avoiding clicking on paid ads.
2022 Q1
• eCommerce - 10.09%
• Lead Gen B2B - 3.67%
• Lead Gen B2C -7.62%
2021 Q4
• eCommerce - 7.63%
• Lead Gen B2B - 4.10%
• Lead Gen B2C - 8.38%.
2021 Q3
• eCommerce - 7.20%
• Lead Gen B2B - 3.68%
• Lead Gen B2C - 6.31%.
2021 Q2
• eCommerce - 5.09%
• Lead Gen B2B - 3.78%
• Lead Gen B2C -6.89%
2021 Q1
• eCommerce - 8.25%
• Lead Gen B2B - 4.14%
• Lead Gen B2C -6.44%
2020 Q4
• eCommcere - 3.63%
• Lead Gen B2B - 2.36%
• Lead Gen B2C - 5.72%
2020 Q3
• eCommerce - 3.27%
• Lead Gen B2B - 2.11%
• Lead Gen B2C - 5.58%.
Why Does Benchmarking Matter?
So, why does all of this data matter? Well, for starters, it is always important to pay attention to which Google Ads campaigns are working great and which ones need to be dropped immediately. When you’re working with paid advertising, knowing where you stand at all times is crucial.
However, publishing this report is designed to help businesses and decision-makers see what other firms in the same industry are experiencing by showing solid data. From there, this gives you an idea of whether your company should make paid ads a part of your overall marketing mix.
Frequently Asked Questions (FAQs)
Now that you’ve seen a lot of information and picked out what’s going on with Google Ads in your niche, it’s time to answer a few common questions you might have.
Where Does This Data Come From?
Data from our digital marketing benchmark report is pulled directly from Google Ads. To help you get a clearer picture of your particular industry, we’ve taken the time to break down the info into the subsections seen above.
How Should Companies Use This Information?
After looking at the information in this Google Ads benchmark report, take time to compare your current campaigns to the ones mentioned in your niche. If there’s a big discrepancy, it might be a good time to get in touch with our ZGM team to decide the best changes to make to your strategy.
What is the Most Important PPC Benchmark Metric to Pay Attention To?
All of the metrics mentioned here are important to track in your own paid advertising campaigns. However, the most important figures that many companies are concerned with are Cost Per Conversion or ROAS. It’s always important to understand how much your business is making for every dollar of advertising money spent, as this can ensure you’re staying on budget and getting a great return for your effort.
Does Cost Per Action Always Mean Sale?
CPA does not always mean a sale. Depending on your industry, whether you’re B2B or B2C, and even your overall goals, this can mean something other than a customer buying a product. For example, an action might mean filling out a form, joining an email list, downloading a lead magnet, or even making a phone call inquiry.
What is the Current State of Paid Advertising as a Marketing Strategy?
Without a doubt, paid advertising is still a solid marketing strategy. Not only does it work more quickly than waiting on organic traffic, but it can create a very nice level of brand recognition for your firm.
Working with ZGM For Better PPC Results
When looking at this PPC benchmark report, it is important to keep in mind that these clients have worked with our ZGM team. They are not attempting to handle paid advertising campaigns alone, but instead, have the knowledge and expertise of our staff to ensure their campaigns are successful. If you’re looking for similar results in one of the industries mentioned above, it might be a good idea to give us a call and start the conversation about your Google Ad goals.
If you have questions about other benchmarks or if you would like us to compare your results against the benchmarks, please contact us for a free consultation.

